
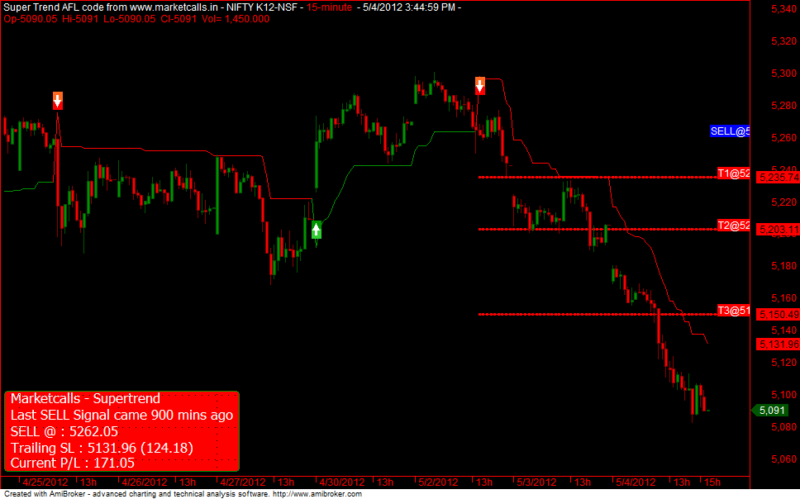
Super Trend Indicator for Amibroker AFL is probably one of the simple trend trading system yet very effective. There is no need for any great software. It is basically ATR based system you add 3 times ATR to mean price on either side of mean price and whenever price crosses the super trend line then the trend changes. Like any other good trend indicator this also has many whipsaws but it captures overall trend well. If you trade regularly on one stock or commodity, you can do well.
This is the ATR BASED TRADING SYSTEM WITH TARGET AND STOPLOSS… It founded on net back test found on good results in 15 minutes. It is the best positional trading system you can use 1 target accuracy is very high.
Super Trend was developed by Olivier Seban , This indicator has the enormous advantage of working on all the time bases and all media.you can use on equities, futures or forex, as well as weekly in 5 minutes. It is ideal to accompany the trends and optimize your output.
Super Trend moving above or below the price depending on the trend developed. He repositioned based on the closing day, which has the main advantage to filter false signals that may occur when the trend slows or during periods without trend.
Super Trend is calculated from a coefficient applied to the average volatility of the last candlesticks or bar charts according to the display mode.
Although the author recommends using the parameters 3 and 10, respectively for the multiplier and the number of candlesticks taken into account to calculate the average volatility, you can adjust them to your needs or affinity.
As the SAR Wilder Super Trend accompanies the award as a follower stop except that it does not progress or does not close on price for the areas of advanced horizontal.This gives more space and time for prices to move, giving you the opportunity to capture a larger movement. You can use it as an indicator of output when this change of direction or position of the stop loss.
Generally it is preferable to focus on positions where buyers Super Trend evolves below the price and hand it is preferable to take only short positions when Super Trend evolves over prices.
How to trade ::
Trade in 15 min timeframe.
Buy once candle close is above ATR LINE in 15 min
Sell once candle close is below ATR Line in 15 Min.
1ST TGT ACCURACY IS HIGH.
Formula
_SECTION_BEGIN("SuperTrend");
SetBarsRequired(100000,0);
GraphXSpace = 15;
SetChartOptions(0,chartShowArrows|chartShowDates);
SetChartBkColor(ParamColor("bkcolor",ColorRGB(0,0, 0)));
GfxSetBkMode(0);
GfxSetOverlayMode(1);
SetBarFillColor(IIf(C>O,ParamColor("Candle UP Color", colorGreen),IIf(C<=O,ParamColor("Candle Down Color", colorRed),colorLightGrey))); Plot(C,"\nPrice",IIf(C>O,ParamColor("Wick UP Color", colorDarkGreen),IIf(C<=O,ParamColor("Wick Down Color", colorDarkRed),colorLightGrey)),64,0,0,0,0);

SetTradeDelays(1,1,1,1);

//////////////////////////////////////////
//Calculates Seconds Left for New Bar //
/////////////////////////////////////////

function GetSecondNum()
{
Time = Now( 4 );
Seconds = int( Time % 100 );
Minutes = int( Time / 100 % 100 );
Hours = int( Time / 10000 % 100 );
SecondNum = int( Hours * 60 * 60 + Minutes * 60 + Seconds );
return SecondNum;
}
RequestTimedRefresh( 1 );
TimeFrame = Interval();
SecNumber = GetSecondNum();
Newperiod = SecNumber % TimeFrame == 0;
SecsLeft = SecNumber - int( SecNumber / TimeFrame ) * TimeFrame;
SecsToGo = TimeFrame - SecsLeft;

x=Param("xposn",50,0,1000,1);
y=Param("yposn",380,0,1000,1);

GfxSelectSolidBrush( ColorRGB( 230, 230, 230 ) );
GfxSelectPen( ColorRGB( 230, 230, 230 ), 2 );
if ( NewPeriod )
{
GfxSelectSolidBrush( colorYellow );
GfxSelectPen( colorYellow, 2 );
Say( "New period" );
}
//GfxRoundRect( x+45, y+40, x-3, y-2, 0, 0 );
//GfxSetBkMode(1);
GfxSelectFont( "Arial", 14, 700, False );
GfxSetTextColor( colorRed );
GfxTextOut( "Time Left :"+SecsToGo+"", x, y );

////////////////////////////////////////////

_N(Title = StrFormat("{{NAME}} - {{INTERVAL}} {{DATE}} Open %g, Hi %g, Lo %g, Close %g (%.1f%%) {{VALUES}}", O, H, L, C, SelectedValue( ROC( C, 1 ) ) ));

Factor=Param("Factor",4,1,10,1);
Pd=Param("ATR Periods",6,1,100,1);
Up=(H+L)/2+(Factor*ATR(Pd));
Dn=(H+L)/2-(Factor*ATR(Pd));
iATR=ATR(Pd);
TrendUp=TrendDown=Null;
trend[0]=1;
changeOfTrend=0;
flag=flagh=0;

for (i = 1; i <BarCount-1; i++) { TrendUp[i] = Null; TrendDown[i] = Null; trend[i]=1; if (Close[i]>Up[i-1]) {
trend[i]=1;
if (trend[i-1] == -1) changeOfTrend = 1;

}
else if (Close[i]<Dn[i-1]) {
trend[i]=-1;
if (trend[i-1] == 1) changeOfTrend = 1;
}
else if (trend[i-1]==1) {
trend[i]=1;
changeOfTrend = 0;
}
else if (trend[i-1]==-1) {
trend[i]=-1;
changeOfTrend = 0;
}

if (trend[i]0) {
flag=1;
}
else {
flag=0;
}

if (trend[i]>0 && trend[i-1]<0) { flagh=1; } else { flagh=0; } if (trend[i]>0 && Dn[i]<Dn[i-1]){
Dn[i]=Dn[i-1];
}

if (trend[i]Up[i-1])
{ Up[i]=Up[i-1];
}

if (flag==1)
{ Up[i]=(H[i]+L[i])/2+(Factor*iATR[i]);;
}
if (flagh==1)
{ Dn[i]=(H[i]+L[i])/2-(Factor*iATR[i]);;
}
if (trend[i]==1) {
TrendUp[i]=Dn[i];
if (changeOfTrend == 1) {
TrendUp[i-1] = TrendDown[i-1];
changeOfTrend = 0;
}
}
else if (trend[i]==-1) {
TrendDown[i]=Up[i];
if (changeOfTrend == 1) {
TrendDown[i-1] = TrendUp[i-1];
changeOfTrend = 0;
}
}
}

Plot(TrendUp,"Trend",colorGreen);
Plot(TrendDown,"Down",colorRed);

Buy = trend==1;
Sell=trend==-1;

Buy=ExRem(Buy,Sell);
Sell=ExRem(Sell,Buy);
Short=Sell;
Cover=Buy;

BuyPrice=ValueWhen(Buy,C);
SellPrice=ValueWhen(Sell,C);
ShortPrice=ValueWhen(Short,C);
CoverPrice=ValueWhen(Cover,C);

Title = EncodeColor(colorWhite)+ "Super Trend AFL code from www.marketcalls.in" + " - " + Name() + " - " + EncodeColor(colorRed)+ Interval(2) + EncodeColor(colorWhite) +
" - " + Date() +" - "+"\n" +EncodeColor(colorRed) +"Op-"+O+" "+"Hi-"+H+" "+"Lo-"+L+" "+
"Cl-"+C+" "+ "Vol= "+ WriteVal(V)+"\n"+
EncodeColor(colorLime)+
WriteIf (Buy , " GO LONG / Reverse Signal at "+C+" ","")+
WriteIf (Sell , " EXIT LONG / Reverse Signal at "+C+" ","")+"\n"+EncodeColor(colorYellow)+
WriteIf(Sell , "Total Profit/Loss for the Last Trade Rs."+(C-BuyPrice)+"","")+
WriteIf(Buy , "Total Profit/Loss for the Last trade Rs."+(SellPrice-C)+"","");

PlotShapes(IIf(Buy, shapeSquare, shapeNone),colorGreen, 0, L, Offset=-40);
PlotShapes(IIf(Buy, shapeSquare, shapeNone),colorLime, 0,L, Offset=-50);
PlotShapes(IIf(Buy, shapeUpArrow, shapeNone),colorWhite, 0,L, Offset=-45);
PlotShapes(IIf(Short, shapeSquare, shapeNone),colorRed, 0, H, Offset=40);
PlotShapes(IIf(Short, shapeSquare, shapeNone),colorOrange, 0,H, Offset=50);
PlotShapes(IIf(Short, shapeDownArrow, shapeNone),colorWhite, 0,H, Offset=-45);

TrendSL=IIf(trend==1,TrendUp,TrendDown);

for(i=BarCount-1;i>1;i--)
{
if(Buy[i] == 1)
{
entry = C[i];
sig = "BUY";
sl = TrendSL[i];
tar1 = entry + (entry * .0050);
tar2 = entry + (entry * .0092);
tar3 = entry + (entry * .0179);

bars = i;
i = 0;
}
if(Sell[i] == 1)
{
sig = "SELL";
entry = C[i];
sl = TrendSL[i];
tar1 = entry - (entry * .0050);
tar2 = entry - (entry * .0112);
tar3 = entry - (entry * .0212);

bars = i;
i = 0;
}
}
Offset = 20;
Clr = IIf(sig == "BUY", colorLime, colorRed);
ssl = IIf(bars == BarCount-1, TrendSL[BarCount-1], Ref(TrendSL, -1));
sl = ssl[BarCount-1];

Plot(LineArray(bars-Offset, tar1, BarCount, tar1,1), "", Clr, styleLine|styleDots, Null, Null, Offset);
Plot(LineArray(bars-Offset, tar2, BarCount, tar2,1), "", Clr, styleLine|styleDots, Null, Null, Offset);
Plot(LineArray(bars-Offset, tar3, BarCount, tar3,1), "", Clr, styleLine|styleDots, Null, Null, Offset);

//Plot(LineArray(bars-Offset, sl, BarCount, sl,1), "", colorDarkRed, styleLine|styleLine, Null, Null, Offset);
//Plot(LineArray(bars-Offset, entry, BarCount, entry,1), "", colorGreen, styleLine|styleLine, Null, Null, Offset);

/*
for (i=bars; i <BarCount;i++)
{
PlotText(""+sig+"@"+entry, BarCount-5,entry,Null,colorBlue);
PlotText("T1@"+tar1,BarCount-5,tar1,Null,Clr);PlotText("T2@"+tar2,BarCount-5,tar2,Null,Clr);PlotText ("T3@"+tar3,BarCount-5,tar3,Null,Clr);

}*/

messageboard = ParamToggle("Message Board","Show|Hide",1);
if (messageboard == 1 )
{
GfxSelectFont( "Tahoma", 13, 100 );
GfxSetBkMode( 1 );
GfxSetTextColor( colorWhite );

if ( sig =="BUY")
{
GfxSelectSolidBrush( colorBlue ); // this is the box background color
}
else
{
GfxSelectSolidBrush( colorRed ); // this is the box background color
}
pxHeight = Status( "pxchartheight" ) ;
xx = Status( "pxchartwidth");
Left = 1100;
width = 310;
x = 5;
x2 = 290;

y = pxHeight;

GfxSelectPen( colorGreen, 1); // broader color
GfxRoundRect( x, y - 98, x2, y , 7, 7 ) ;
GfxTextOut( ( "Marketcalls - Supertrend"),13,y-100);
GfxTextOut( (" "),27,y-100);
GfxTextOut( ("Last " + sig + " Signal came " + (BarCount-bars-1) * Interval()/60 + " mins ago"), 13, y-80) ; // The text format location
GfxTextOut( ("" + WriteIf(sig =="BUY",sig + " @ ",sig + " @") + " : " + entry), 13, y-60);
GfxTextOut( ("Trailing SL : " + TrendSL + " (" + WriteVal(IIf(sig == "SELL",entry-sl,sl-entry), 2.2) + ")"), 13, y-40);
/*GfxTextOut( ("TGT:1 : " + tar1), 13, y -80);
GfxTextOut( ("TGT:2 : " + tar2), 13,y-60);
GfxTextOut( ("TGT:3 : " + tar3), 13,y-40);*/
GfxTextOut( ("Current P/L : " + WriteVal(IIf(sig == "BUY",(C-entry),(entry-C)),2.2)), 13, y-22);;

//Magfied Market Price
FS=Param("Font Size",30,11,100,1);
GfxSelectFont("Times New Roman", FS, 700, True );
GfxSetBkMode( colorWhite );
GfxSetTextColor( ParamColor("Color",colorGreen) );
Hor=Param("Horizontal Position",940,1,1200,1);
Ver=Param("Vertical Position",12,1,830,1);
GfxTextOut(""+C, Hor , Ver );
YC=TimeFrameGetPrice("C",inDaily,-1);
DD=Prec(C-YC,2);
xx=Prec((DD/YC)*100,2);
GfxSelectFont("Times New Roman", 11, 700, True );
GfxSetBkMode( colorBlack );
GfxSetTextColor(ParamColor("Color",colorYellow) );
GfxTextOut(""+DD+" ("+xx+"%)", Hor , Ver+45 );

}

_SECTION_END();
/*
_SECTION_BEGIN("Time Left");
function GetSecondNum()
{
Time = Now( 4 );
Seconds = int( Time % 100 );
Minutes = int( Time / 100 % 100 );
Hours = int( Time / 10000 % 100 );
SecondNum = int( Hours * 60 * 60 + Minutes * 60 + Seconds );
return SecondNum;
}
RequestTimedRefresh( 1 );
TimeFrame = Interval();
SecNumber = GetSecondNum();
Newperiod = SecNumber % TimeFrame == 0;
SecsLeft = SecNumber - int( SecNumber / TimeFrame ) * TimeFrame;
SecsToGo = TimeFrame - SecsLeft;

x=Param("xposn",50,0,1000,1);
y=Param("yposn",380,0,1000,1);

GfxSelectSolidBrush( ColorRGB( 230, 230, 230 ) );
GfxSelectPen( ColorRGB( 230, 230, 230 ), 2 );
if ( NewPeriod )
{
GfxSelectSolidBrush( colorYellow );
GfxSelectPen( colorYellow, 2 );
Say( "New period" );
}
//GfxRoundRect( x+45, y+40, x-3, y-2, 0, 0 );
//GfxSetBkMode(1);
GfxSelectFont( "Arial", 14, 700, False );
GfxSetTextColor( colorRed );
GfxTextOut( "Time Left :"+SecsToGo+"", x, y );
_SECTION_END(); */